Appearance
Shortcuts
Preview
F5: refresh the preview
Ctrl F5: refresh all voxel worlds using this graph in all level viewports
Nodes & links
The usual UE shortcuts work in voxel graphs:
Alt Click on a pin to disconnect all its links
Ctrl Drag on a pin to another pin to move all connections
Adding new nodes
You can spawn new nodes by holding a key and clicking on the graph.
The key mappings can be configured in the Shortcuts tab, default ones include:
X/Y/Z to spawn a X (or Y, Z) node
Numpad + - / * to spawn the corresponding math node
Previewing
Preview tabs
The voxel graph editor has 2 preview tabs: the 2D preview and the 3D preview tabs.
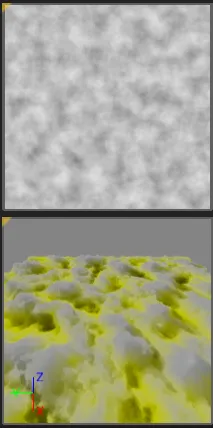
2D Preview
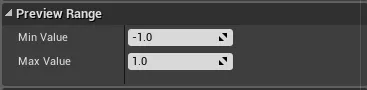
The 2D preview tab shows a greyscale image of the previewed value. The previewed zone is configured with the following settings:
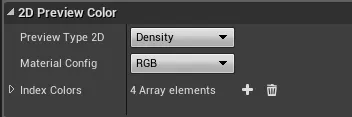
You can configure the black & white values with the following settings:
Values <= Min Value will be black, and Values >= Max Value white.
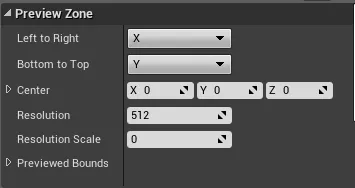
3D Preview
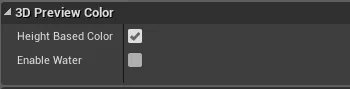
The 3D preview is a tessellated plane using the 2D preview texture as heightmap. The color is height-based.
Previewing materials
Additionally to previewing a value, you can also preview the outputted material with the following settings:
To see the materials in the 3D preview, you'll need to turn off the Height Based Color option:
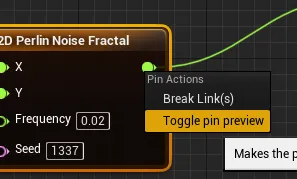
Previewing a specific pin
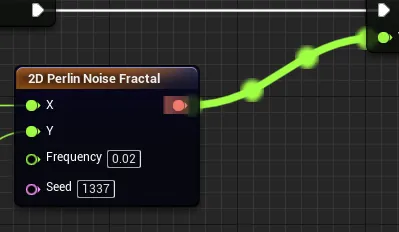
You can preview any float pin in your graph. To do so, right click it and choose Toggle Pin Preview:
Once previewed:
Range Analysis
Range analysis is primarily used to speed up generation times. However, it can also be used when creating graphs.
To do so, turn on Range Analysis Debug:
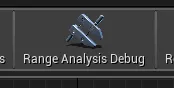
This will display under each node the possible pin values:
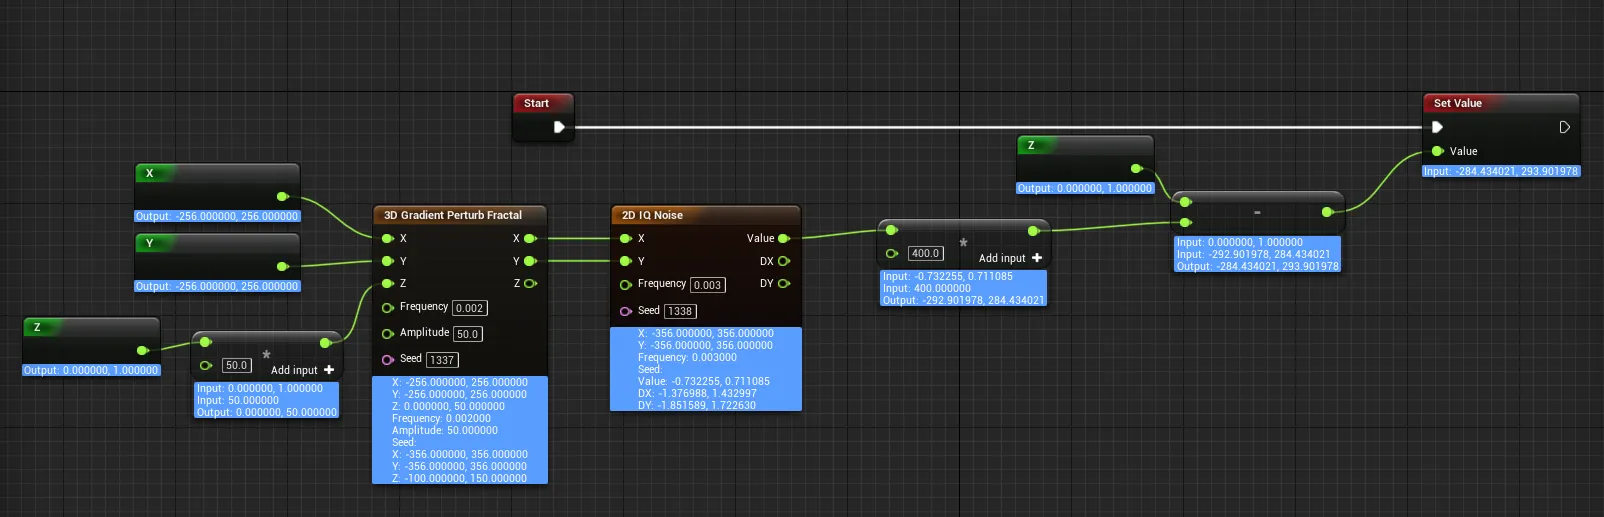
Keep in mind this is just an estimation, and only guarantees that the value will be within these bounds, not that it will reach them!
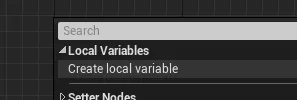
Local Variables
You can create a new local variable in the context menu:
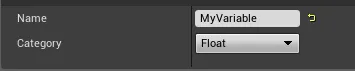
You can configure its name & type in the node details panel:
Then, you can use it anywhere by choosing it in the context menu!
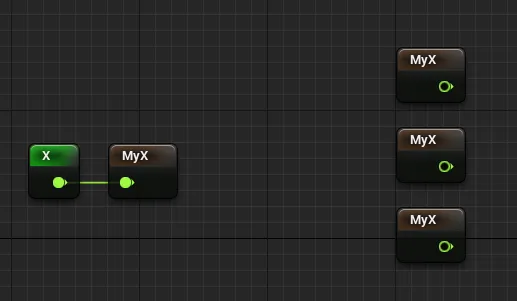
Using local variables has no cost at all, it's just a visual helper: they are linked together when compiling the graph.